

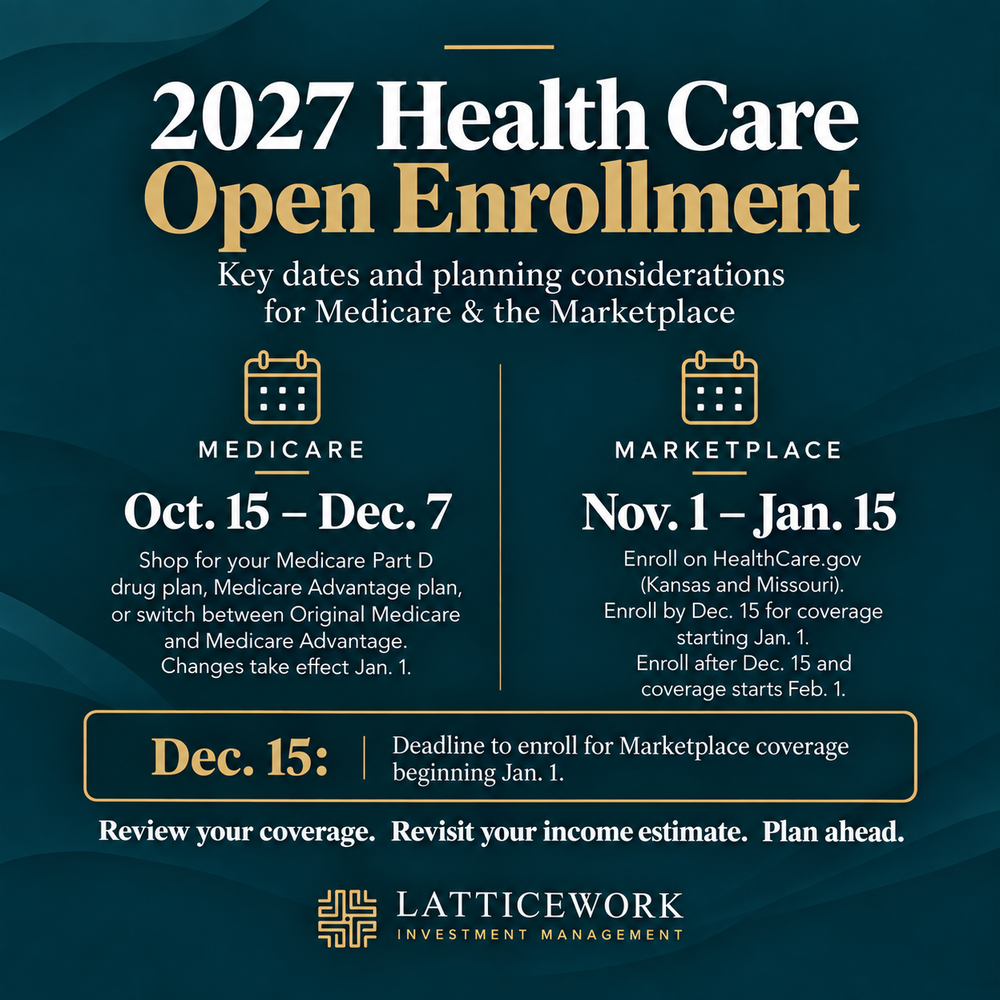
October means open enrollment time for both Medicare and under-65 health insurance. The choices you make this fall lock in your costs for all of 2027, and several rules and numbers have changed. Here is what you need to know: Medicare Annual Enrollment runs October 15 through December 7. Anyone on Medicare can shop for their Medicare Part D drug plan or Medicare Advantage plan during this window. Changes take effect January 1. Review your Part D plan every year, even if you are happy with it. Plans change their premiums, covered drug lists, and preferred pharmacies every year. The plan that was cheapest for your prescriptions last year may not be this year. Enter your current prescriptions into the Plan Finder at Medicare.gov, or let us run the comparison with you. Part D cost-sharing limits are increasing in 2027. The maximum deductible rises to $700 (from $615 in 2026), and the annual out-of-pocket cap rises to $2,400 (from $2,100). Once you reach the cap, covered drugs cost $0 for the rest of the year. Already in a Medicare Advantage plan? You get one more chance to change. Between January 1 and March 31, people enrolled in a Medicare Advantage plan can make one change: switch to a different Advantage plan, or return to Original Medicare and add a Part D plan. This window cannot be used to move from Original Medicare into Advantage or to switch stand-alone Part D plans. Keep in mind that returning to Original Medicare does not guarantee you can buy a Medicare supplement, which may require medical underwriting. Medicare supplements, often called Medigap plans, can be shopped at any time, but usually require medical underwriting. Outside of your initial enrollment window, the insurance company can decline you or charge more based on your health, and the Annual Enrollment period does not change that. If you are healthy and your supplement premium keeps climbing, it may be worth pricing the same plan with other companies while you can still qualify. Missouri residents have an extra option. Missouri’s anniversary rule lets you switch to the same Medigap plan (for example, Plan G to Plan G) with any company, with no health questions, if you act within 30 days of your policy’s anniversary date. Kansas does not currently have a similar rule. IRMAA: watch your income from two years ago. Higher-income Medicare beneficiaries pay a surcharge on Part B and Part D premiums called IRMAA. It is based on your tax return from two years earlier, so your 2027 premiums are based on your 2025 income, and the income you create this year will set your 2028 premiums. In 2026, surcharges began at modified adjusted gross income above $109,000 for single filers and $218,000 for joint filers. The 2027 thresholds and Part B premium will be announced later this fall. IRMAA works like a cliff: going $1 over a threshold triggers the full surcharge for that bracket. Roth conversions, large IRA withdrawals, capital gains, and the sale of a business or property are the usual culprits. If your income has dropped because of certain qualifying life-changing events, such as retirement, reduced work, the death of a spouse, or divorce, you may be able to ask Social Security to use more recent income information by filing Form SSA-44. Under 65: The Health Insurance Marketplace Open enrollment begins November 1, 2026 on HealthCare.gov, which both Kansas and Missouri use. As of September 2026, HealthCare.gov lists January 15, 2027 as the final enrollment deadline. December 15 is the date that matters most. Choose your plan by December 15 for coverage that starts January 1. Plans chosen after that start February 1, which can leave a gap in coverage. Do not let your plan simply auto-renew. Premiums are rising again for 2027, several insurers are leaving markets or shrinking, and your plan’s doctors and hospitals may change. If your plan is discontinued, you could be moved into a replacement you did not choose. Log in, update your income estimate, and compare. Income limits for tax credits are back. The enhanced subsidies in place from 2021 through 2025 expired at the end of 2025 and have not been renewed. For 2027 coverage, premium tax credits are available only to households with income between 100% and 400% of the federal poverty level. Above 400% of the federal poverty level, the premium tax credit is generally unavailable, so even a small amount of income above the limit can result in the loss of a substantial premium tax credit.
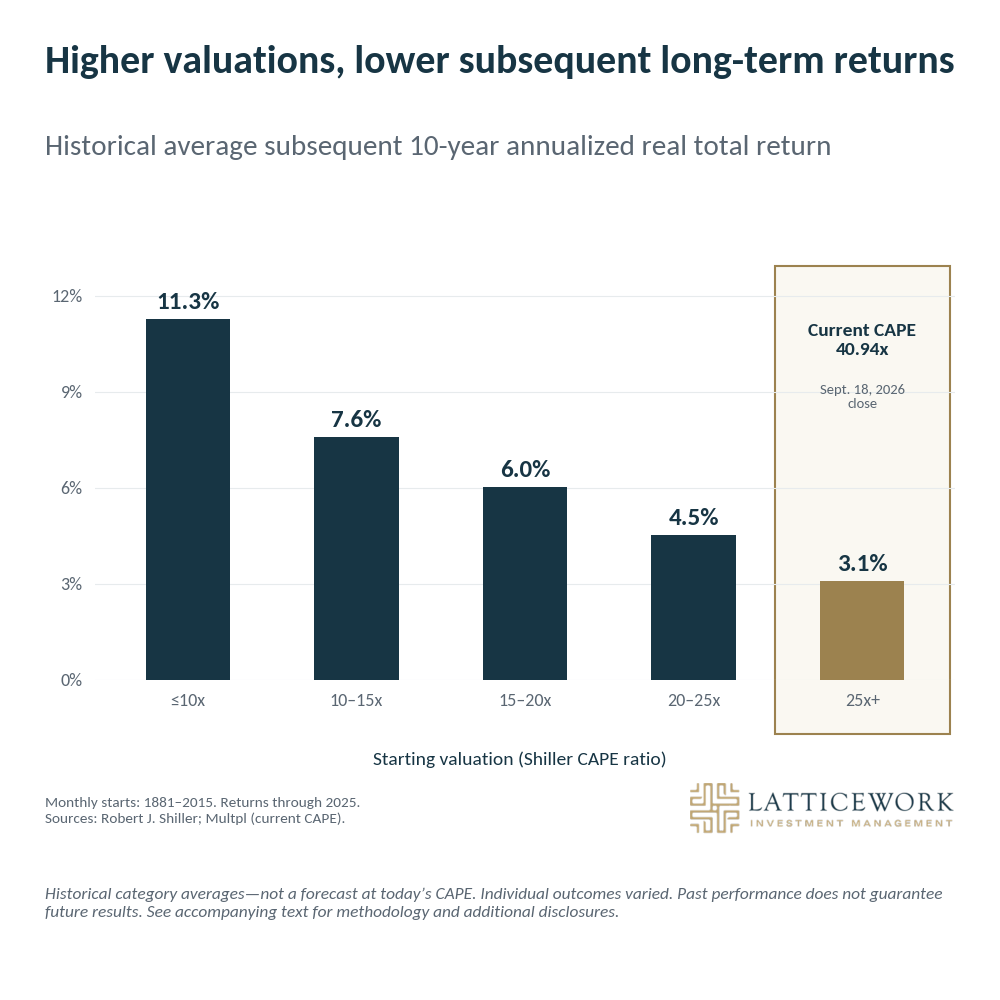
Something that Preston and I have discussed at length is our concern about current valuations across the stock market. Our greatest concern is high-priced U.S. growth stocks, though it is not confined to them. We are not alone in this. In a July 15, 2026, CNBC interview, Warren Buffett summed up the environment in ten words: “It’s tough to find values when everybody is preferring gambling.”[1] The ratio of total U.S. stock market capitalization to GDP — a measure Buffett himself popularized — now stands above 230%, within a few points of its all-time high.[2] In 2001, Buffett wrote that investors were playing with fire if that ratio approached 200%.[3] A different valuation measure tells a similar story: the Shiller CAPE ratio for the S&P 500 is approximately 41, a level reached only near the peak of the dot-com bubble.[4] Berkshire Hathaway's actions back up Buffett's words. After fourteen straight quarters as a net seller of stocks, the company ended March holding nearly $400 billion in cash — one of the largest corporate cash positions in American history.[5] I want to be careful here, because we are not calling for a market correction, and we view timing the market as a loser’s game. Buffett is not calling for one either (Berkshire turned net buyer of stocks in the second quarter of 2026). [5] High valuations are not a sell signal. They can persist for years, and waiting for a cheaper entry point can mean missing further gains. What elevated valuations do tell us is something more modest and more useful: the price you pay can influence the return you can reasonably expect. In our view, today’s prices leave very little cushion for disappointment. Most businesses growing at a normal rate are already priced as exceptional ones.

Planning for what we hope is a multi-decade retirement is something that deserves significant time and consideration. Here is where to start: Social Security Have a tailored Social Security plan for your retirement. An NBER study found that the median household headed by someone ages 45 to 62 gives up $182,370 in lifetime spending by not optimizing when they claim. For our clients, we use an analysis tool that requires your specific information and generates a plan tailored to you. Health Insurance Understanding the ins and outs of Medicare is vital. You need to consider all costs, not just the premiums, and ensure that you navigate the enrollment windows. Getting this wrong could lead to either unnecessary premiums or to lifelong penalties. However, retirement doesn’t always need to wait until Medicare starts. With some good financial planning and healthcare tax credits, an early retirement could be available. Investments Understand what you own and why. In most cases, we see that a moderate allocation between stocks and bonds is appropriate for pre-retirees and retirees. Which stocks and bonds you own is important. Ensure you have an advisor that can adequately explain the different types and which environments they make sense in. In the current environment we see a lot of growth-focused stock portfolios. Understand the risk inherent in growth stocks and consider value stocks, small-cap stocks, and international stocks too. Fees and Taxes These can erode your hard-earned wealth. Understand what your advisor costs, what the underlying securities cost, and if they are tax efficient. Financial products are not free. Annuities have fees, spreads, and commissions. Index funds have inefficiencies and expense ratios. Mutual funds can have 12b-1 fees and capital gains distributions. None of these are necessarily bad, but taxes and fees directly affect outcomes. Source: NBER Working Paper 30675 (2022) — https://doi.org/10.3386/w30675 Advisory services offered by Latticework Investment Management, LLC. The information above is for educational and informational purposes only and should not be considered personalized financial, investment, tax, or legal advice.