


Are Today’s Stock Prices Borrowing from Tomorrow’s Returns?
Something that Preston and I have discussed at length is our concern about current valuations across the stock market. Our greatest concern is high-priced U.S. growth stocks, though it is not confined to them.
We are not alone in this. In a July 15, 2026, CNBC interview, Warren Buffett summed up the environment in ten words: “It’s tough to find values when everybody is preferring gambling.”[1]
The ratio of total U.S. stock market capitalization to GDP — a measure Buffett himself popularized — now stands above 230%, within a few points of its all-time high.[2] In 2001, Buffett wrote that investors were playing with fire if that ratio approached 200%.[3]
A different valuation measure tells a similar story: the Shiller CAPE ratio for the S&P 500 is approximately 41, a level reached only near the peak of the dot-com bubble.[4] Berkshire Hathaway's actions back up Buffett's words. After fourteen straight quarters as a net seller of stocks, the company ended March holding nearly $400 billion in cash — one of the largest corporate cash positions in American history.[5]
I want to be careful here, because we are not calling for a market correction, and we view timing the market as a loser’s game. Buffett is not calling for one either (Berkshire turned net buyer of stocks in the second quarter of 2026). [5] High valuations are not a sell signal. They can persist for years, and waiting for a cheaper entry point can mean missing further gains.
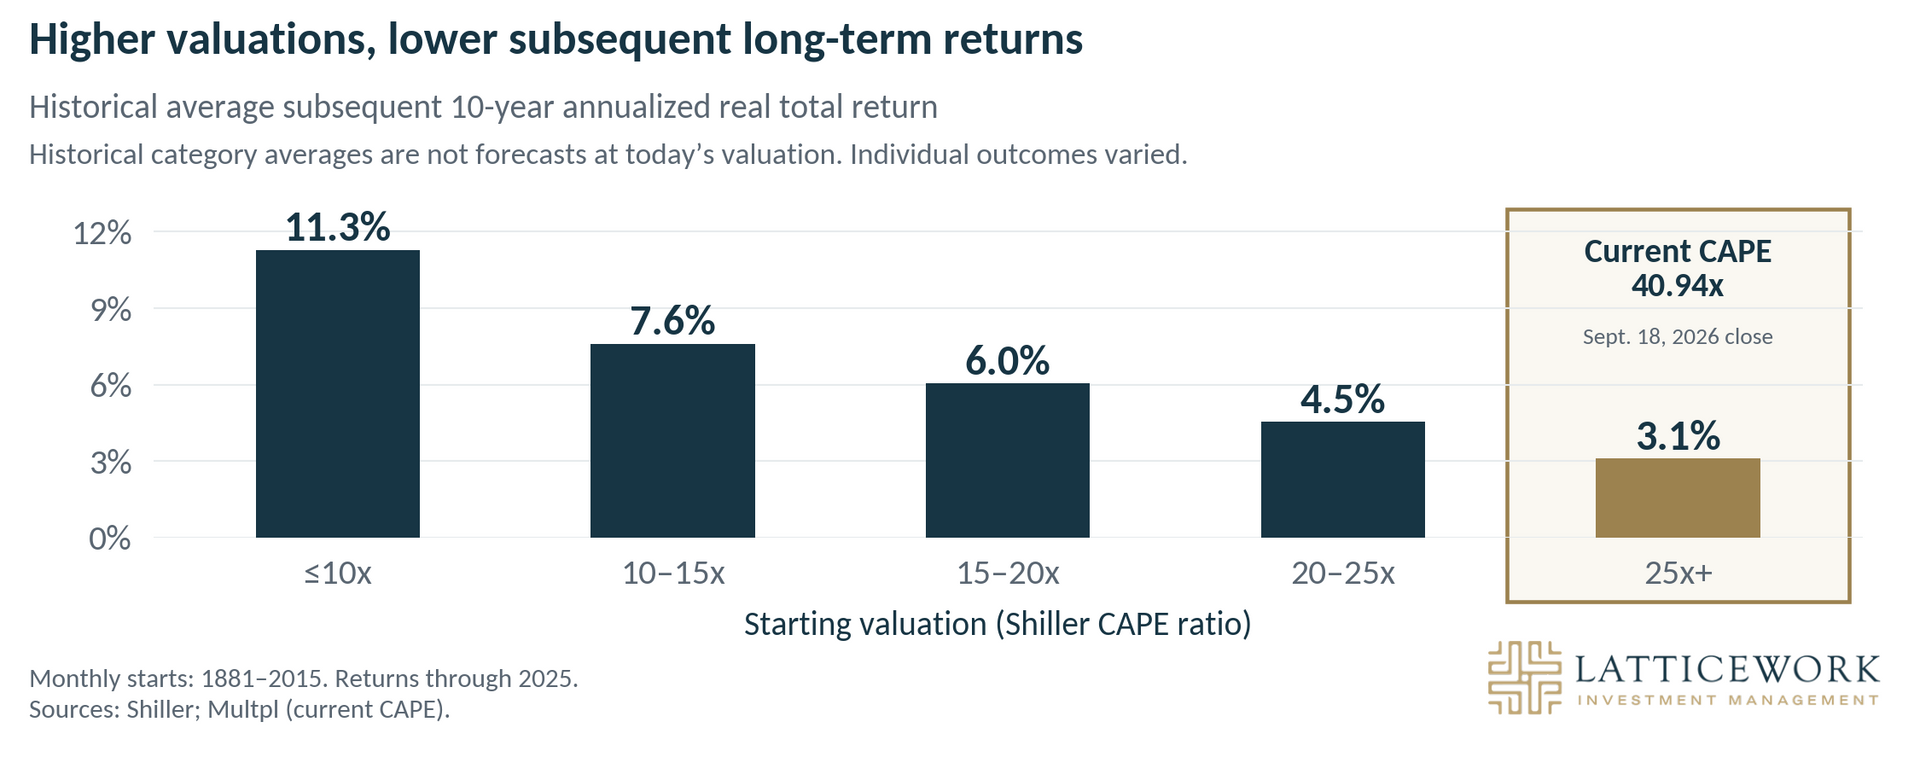
What elevated valuations do tell us is something more modest and more useful: the price you pay can influence the return you can reasonably expect. In our view, today’s prices leave very little cushion for disappointment. Most businesses growing at a normal rate are already priced as exceptional ones.


Chart sources: Robert J. Shiller; Multpl.[4,6] CAPE: 40.94x at the September 18, 2026, close. Bars show average subsequent ten-year annualized real total returns for 1,620 overlapping monthly starting periods from 1881–2015, with returns through 2025. Returns include reinvested dividends and are adjusted for inflation, before fees, trading costs and taxes. The periods are not independent. Ranges exclude the lower boundary and include the upper; “25x+” means greater than 25x. Outcomes varied widely. The highlighted bar is a historical category average, not a forecast at today’s valuation. Past performance does not guarantee future results.
For most of our clients, the practical question isn’t whether to be in the market. It is whether their portfolio is built to survive a bad stretch at the wrong moment. If you are five years from retirement, or five years into it, the timing of losses matters. Poor returns early in retirement, combined with withdrawals, can do lasting damage by leaving fewer assets to participate in a recovery. That risk can be managed but is often ignored.
That is the part worth thinking about right now — not the forecast, but the construction.
SOURCES
1. CNBC. Buffett on the market. July 15, 2026. The quotation is reproduced in CNBC’s official post linking to its interview coverage.
2. GuruFocus. U.S. market capitalization to GDP. The page reports 234.6% for September 19, 2026, against a series high of 236.4%. Indicator definitions and coverage vary by provider.
3. Warren Buffett, Fortune. Stock market essay. December 10, 2001.
4. Multpl. Shiller PE Ratio. September 18, 2026 close: 40.94x. Historical maximum: 44.19 in December 1999. CAPE uses ten years of inflation-adjusted earnings.
5. Berkshire Hathaway. First- and second-quarter 2026 Forms 10-Q. Consolidated cash, cash equivalents and short-term Treasury bills totaled $397.383 billion at March 31 and $365.514 billion at June 30. These totals include unsettled Treasury purchases. Second-quarter equity purchases of $23.467 billion exceeded sales of $3.693 billion, calculated by subtracting first-quarter cash flows from first-half cash flows.
6. Robert J. Shiller. U.S. stock market data. Latticework calculations from ie_data.xls, retrieved September 18, 2026. Each return equals (real total return index at month t+120 ÷ index at month t)^(1/10) − 1. Category averages of 11.3%, 7.6%, 6.0%, 4.5% and 3.1% were recalculated and confirmed. The series includes historical predecessor data, not the modern S&P 500 throughout. Results depend on the sample and category definitions; indexes cannot be invested in directly.
Investment advisory services are offered by Latticework Investment Management, LLC. The information above is for educational and informational purposes only and should not be considered personalized financial, investment, tax or legal advice. Investing involves risk, including possible loss of principal.
Recent Posts


